What is DuPont Analysis?
The DuPont analysis (also known as the Dupont identity or DuPont model) is a useful framework that breaks down financial ratios (ROA and ROE) to gain a better understanding of each component of the equations. It is not just focusing on finding what ROA and ROE are, rather it aims to explain how all the variables affect a company’s performance. By decomposing ROA and ROE, companies can focus on the key metrics of financial performance individually to identify opportunities and threats and adjust their activities to gain higher profits.
DuPont analysis ROA and ROE
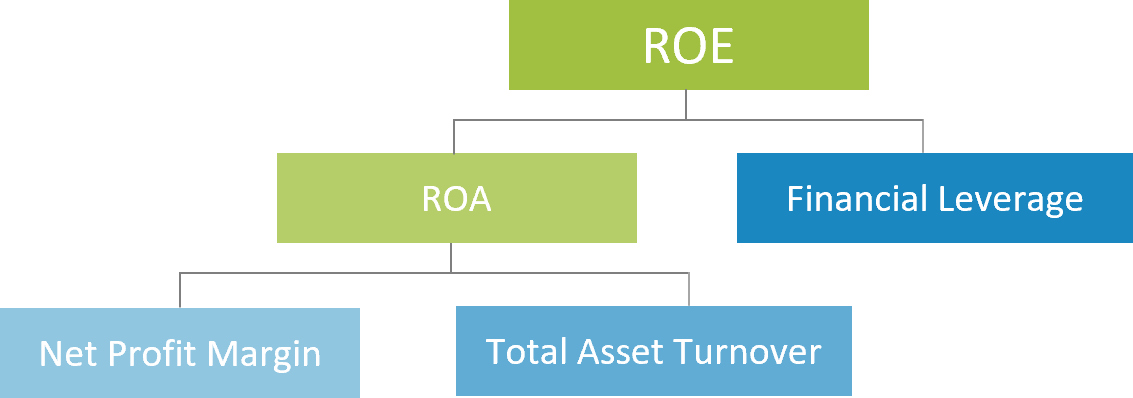
Return on Assets indicates how well a company deploys its assets to generate profit. In other words, Return on Assets shows how well the company performs by using just what it already has (before leverage is considered). In contrast, Return on Equity measures a firm’s efficiency at generating profits from every unit of shareholders’ equity. Return on assets is a vital component of return on equity (see picture below):

DuPont Analysis ROA = Net Profit Margin × Asset Turnover
DuPont Analysis ROA and ROE = Net Profit Margin × Asset Turnover x Leverage
where:
Net Profit Margin = Revenue / Net Income
Asset Turnover = Average Total Assets / Sales
Leverage or Equity Multiplier = Average Shareholders’ Equity / Average Total Assets
How does it work in Invest for Excel?
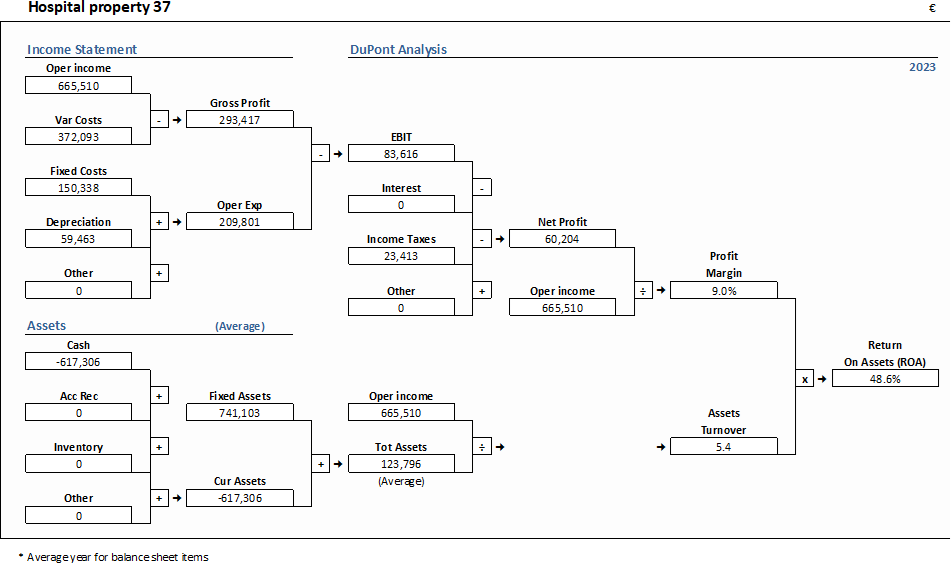
Create the DuPont analysis instantly in Invest for Excel with a click of a button!

Invest for Excel test version – download for free!
In Invest for Excel you can create two types of DuPont analysis:
1. Short Analysis (ROA), that represents the calculation of Return on Assets (Return on Investments).
2. Long Analysis (ROA and ROE), where the financing part of DuPont is included, and ROE is calculated.


