
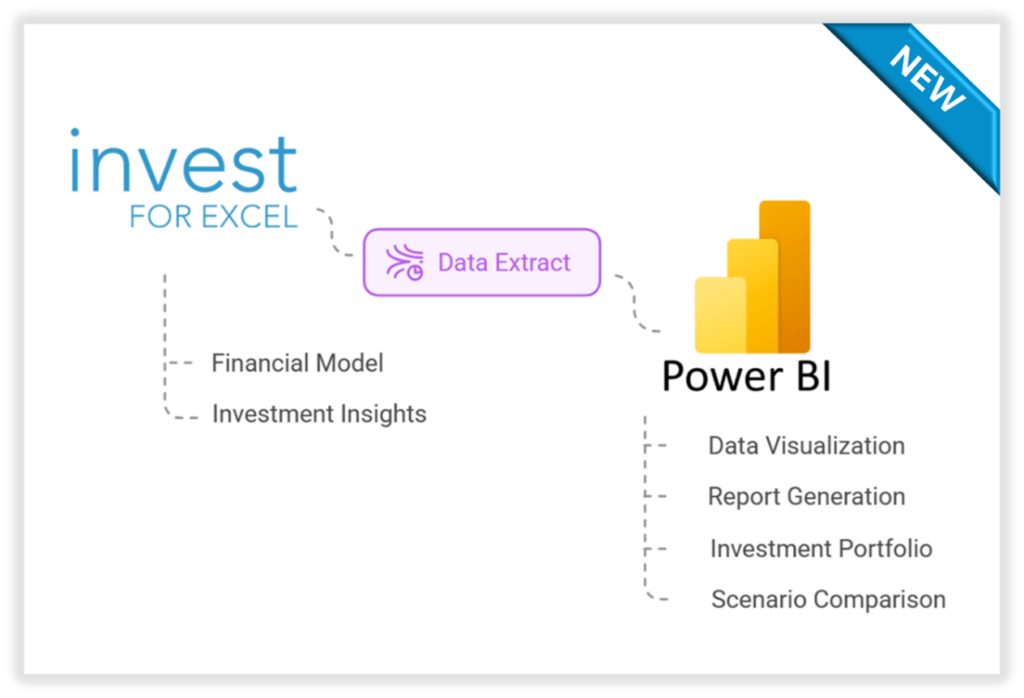
Use a new function of Data Extract in Invest for Excel® version 4.2. Extract data from financial models created in Invest for Excel® calculation files and connect to Power BI and other apps. Data extract can also be used to analyse calculation data in Excel, for example in using Pivot tables.
In Power BI, the data extract enables users to design and create customised reports, for example on Investments/ Project Portfolio, Consolidation, Scenario Comparison and more, fast and visually appealing. Get the edge on overseeing and managing investment strategies and protecting your profitability.
How to start?
Unless you have already had Power BI installed, you may want to start by downloading a free app: Power BI Desktop. Download free test version of Invest for Excel® here or visit our online store.
Whether you are an experienced user of Power BI or have never used the app, start creating advanced Power BI reports that will support you overseeing and managing investment strategies and protecting your profitability.
Invest for Excel® and Power BI can be used together to create customised reports such as Investment Portfolio or Scenario Comparison; to visualise data and more.
About a new function – Data Extract
Invest for Excel® version 4.2. enables users to extract data from calculation files that can be then connected to applications such as Power BI, Power BI Desktop (free of charge) and other apps.
Use “Data extract” function in the IFE File – Data menu.
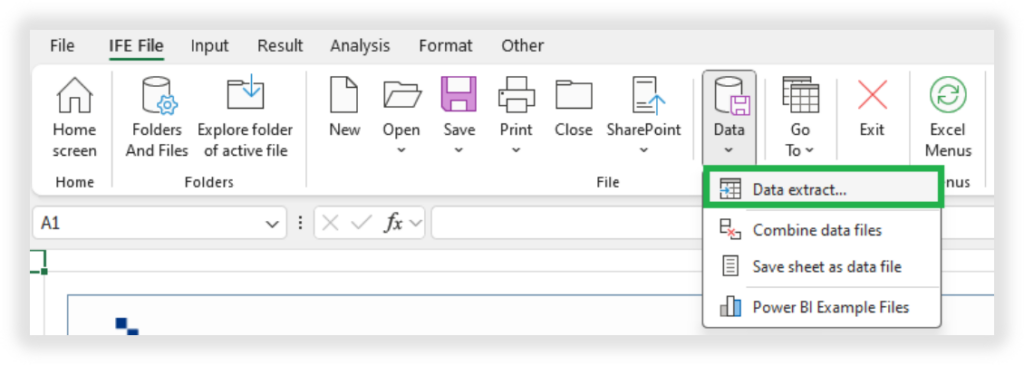
Data Extract function in Invest for Excel® software.
Data extract is useful when you want to use Invest for Excel® data in a database type of application, for example Microsoft Power BI Desktop. Power BI has been used in this article as examples of how the extracted data can be used. Data can of course also be used in other applications.
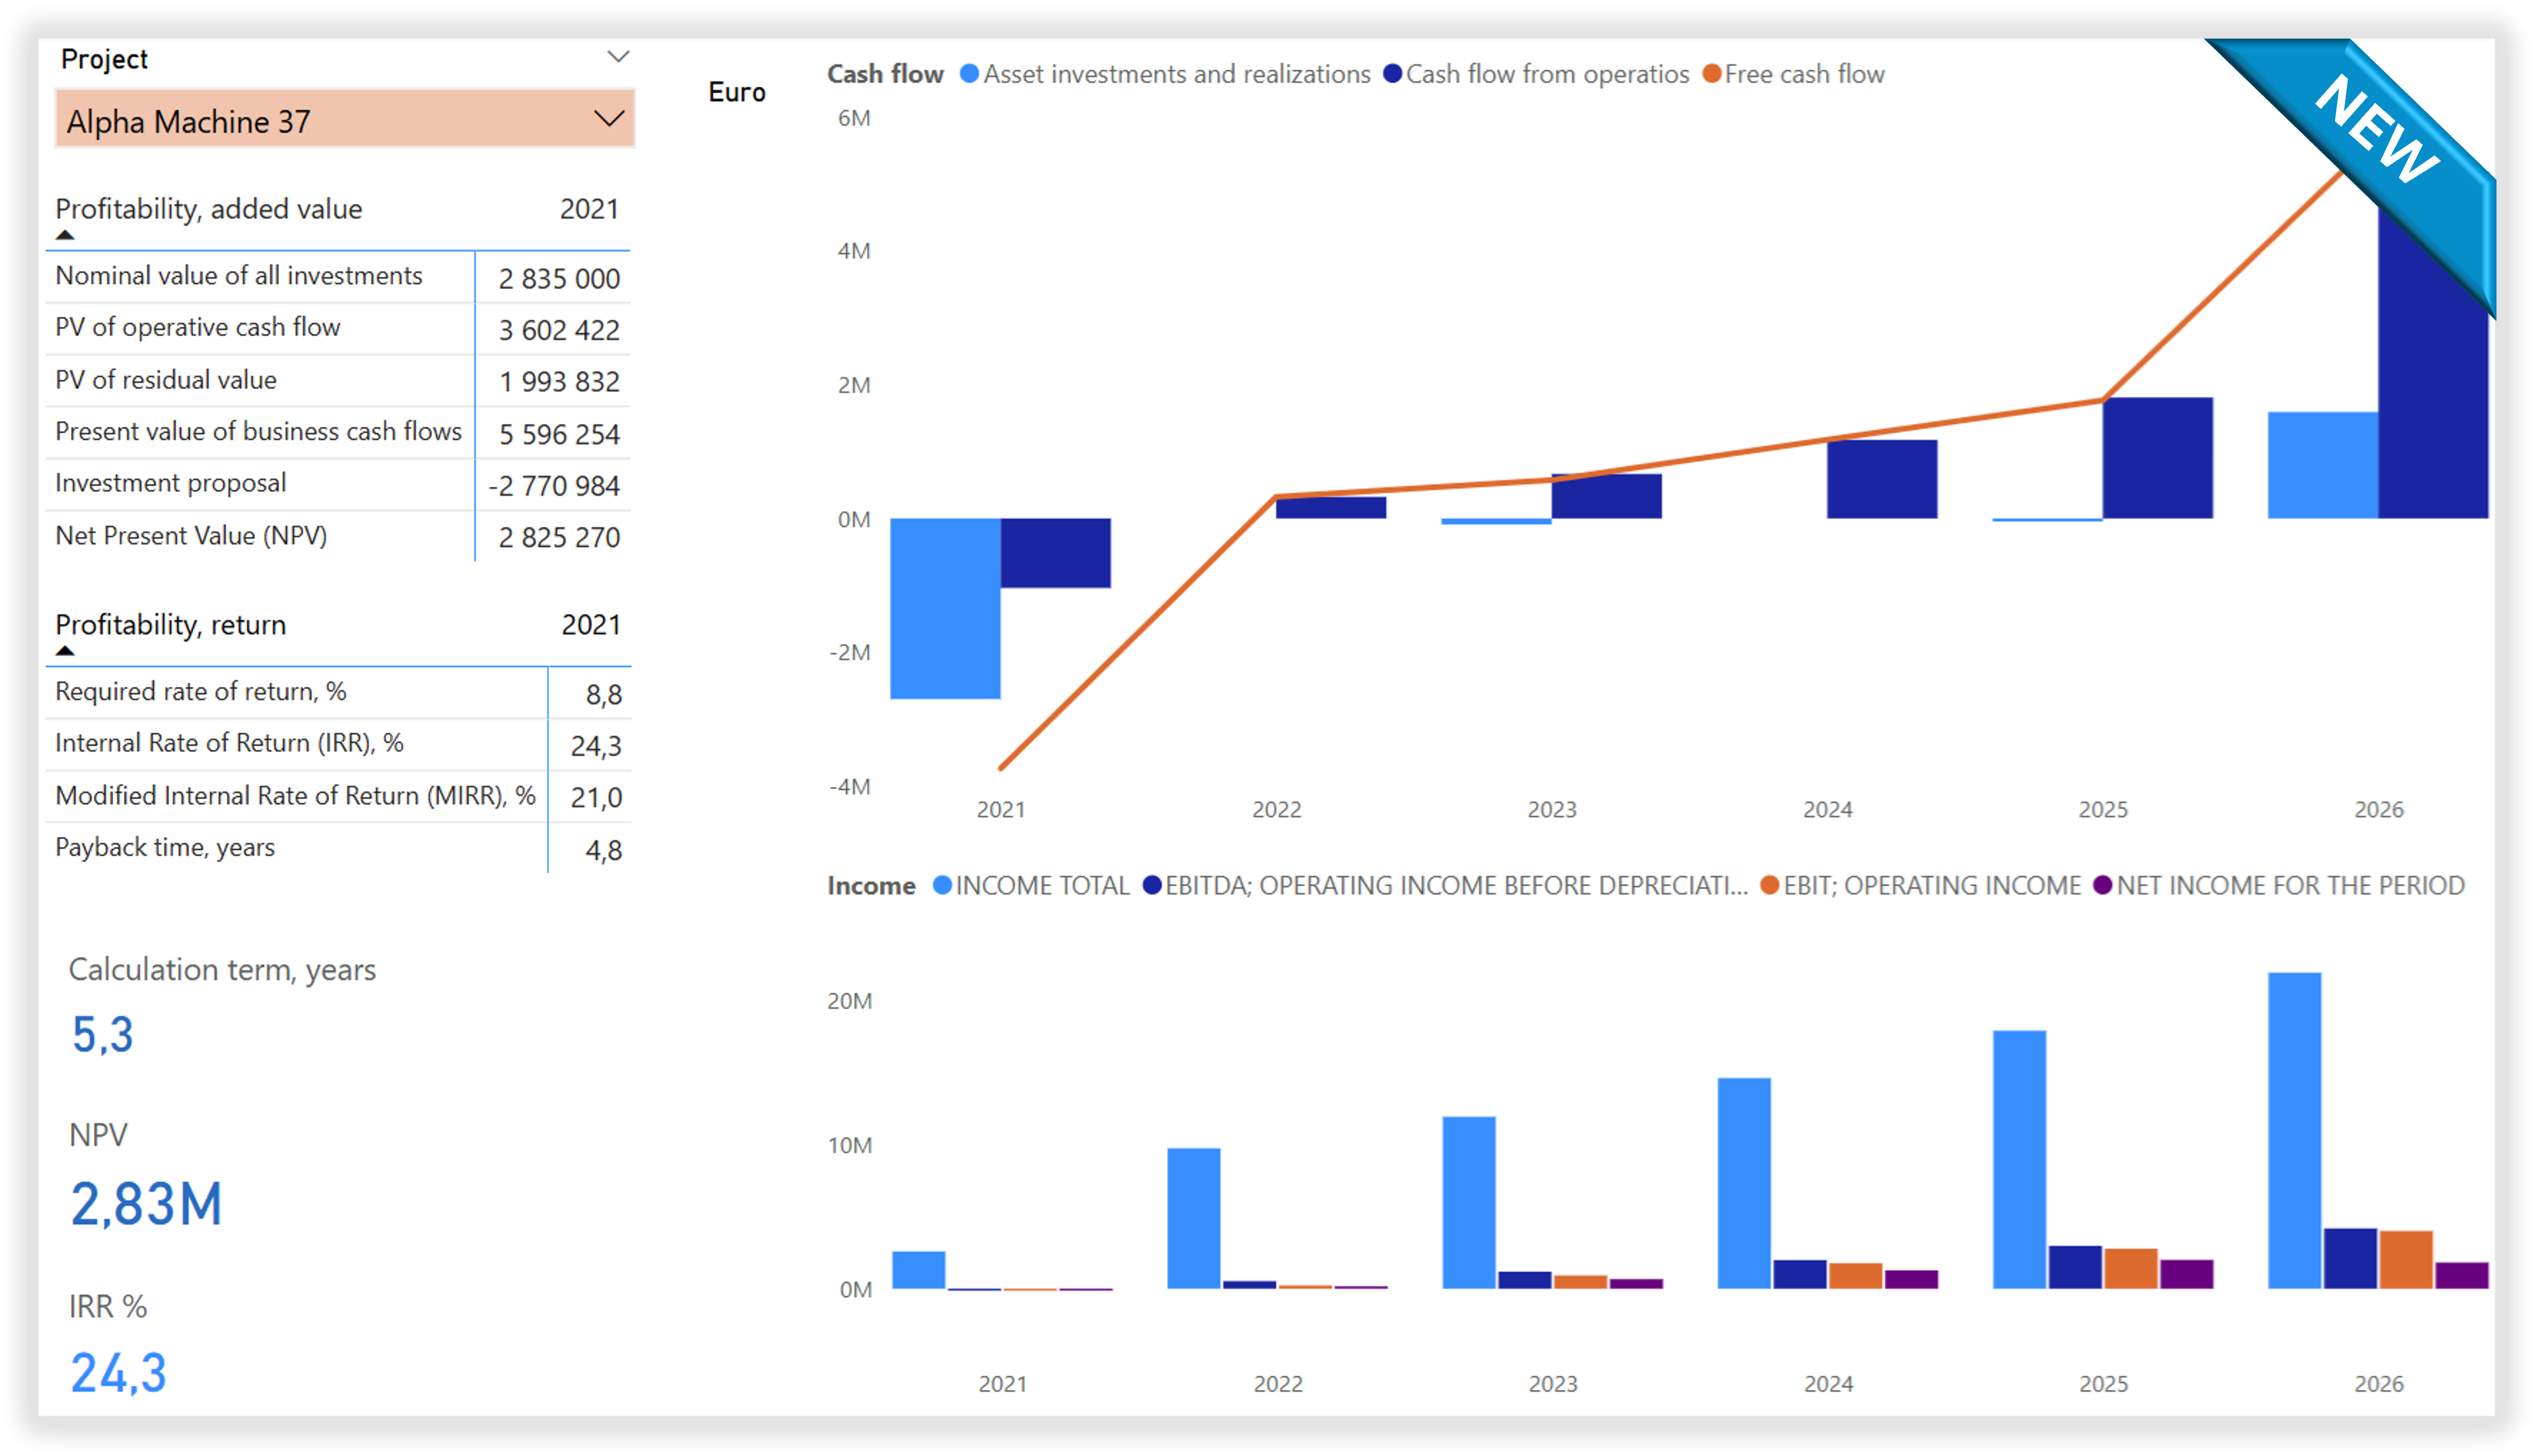
Example of how the extracted data can be used.
Data extract can also be used to analyse calculation data in Excel, for example in using Pivot tables.
What kind of data can be extracted?
You can choose to include investment data, income data, working capital data, cash flow data, balance sheet data, key financials table data from Calculations sheet and profitability indicators from Result sheet of a calculation file developed in Invest for Excel®. Each type of data is extracted to a separate sheet/data file.
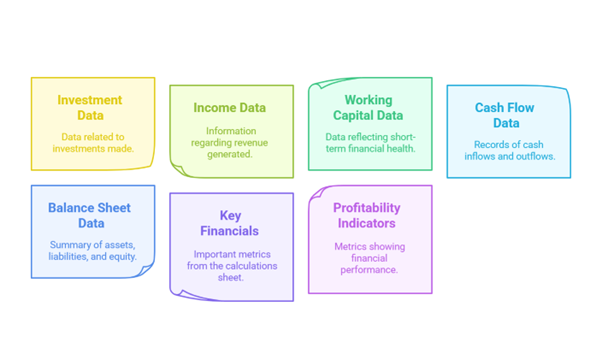
Options of Data extract from Invest for Excel®
Simply, click on a Data Extract function in Invest for Excel’s menu, select the relevant data in a convenient pop-up window and get the extract files ready, instantly.
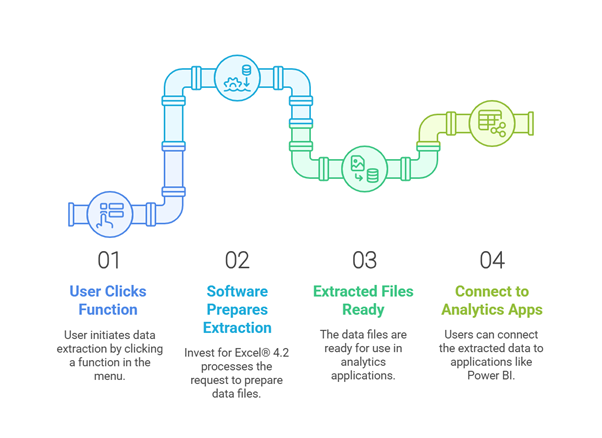
Data Extract Process in Invest for Excel®
Create advanced reports in Power BI /Power BI Desktop
You might want to consider these ideas when creating a report.
You can create reports showing a single project or investments portfolio consisting of multiple projects – depending on your needs.
If you decide to create a portfolio of investments – or projects, or feasibility studies – report, you can further customise it. For example, you can select multiple projects to view as a sub-group or view just a single, individual project. Such a design gives you multiple and flexible options for analysing your projects portfolio and always enabling you to discover the total impact of selected combinations. NOTE! The projects can represent totally different business segments.
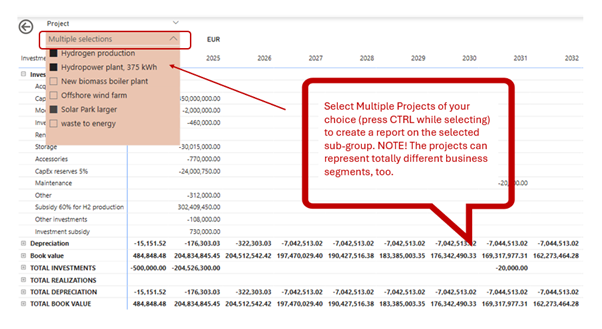
Example of a matrix report in Power BI – Investment data representing a sub-group of three selected projects out of six renewable energy projects portfolio, as selected by a user.
View ready Power BI report example files designed by DataPartner
View examples delivered to you by DataPartner. You will find them on the top menu under Data Extract Tab. For example:
- Portfolio of Investments and Projects Power BI report example by DataPartner.
- Scenarios comparison Power BI report example by DataPartner.
HINT! The Power BI example files show a selection of investment projects. You might want to use example Power BI files designed by DataPartner and connect to your own data extracts of calculations developed in Invest for Excel® – and get advanced reports of your projects and investments.
You can also build other reports in Power BI based on data extracts from Invest for Excel®, according to your needs.
Cash flow report of an investment – Power BI report based on data extracts from a Invest for Excel® calculation file
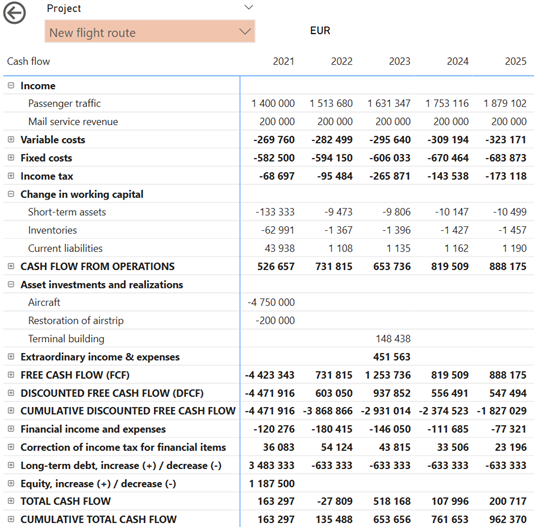
Example of a matrix report in Power BI – Cash flow from a Invest for Excel® example file.
Get a report on a portfolio of investments or projects – see projects separately and combined
In the below example, you’ll see investments and realizations of four investments – individual investment’ cash flow separately and combined. NOTE! The report can be detailed i.e. you can see cash flows as per asset in every investment project, if you choose so.
Power BI report based on data extracts from several Invest for Excel® calculation files – several projects
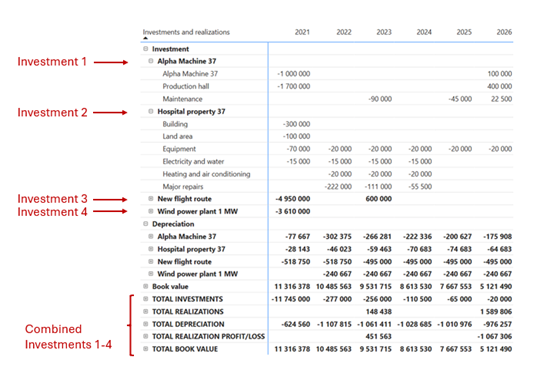
Example of a matrix report in Power BI – Investment data from four example files.
Compare scenarios or projects – charts and reports
Compare investments and projects side-by-side.
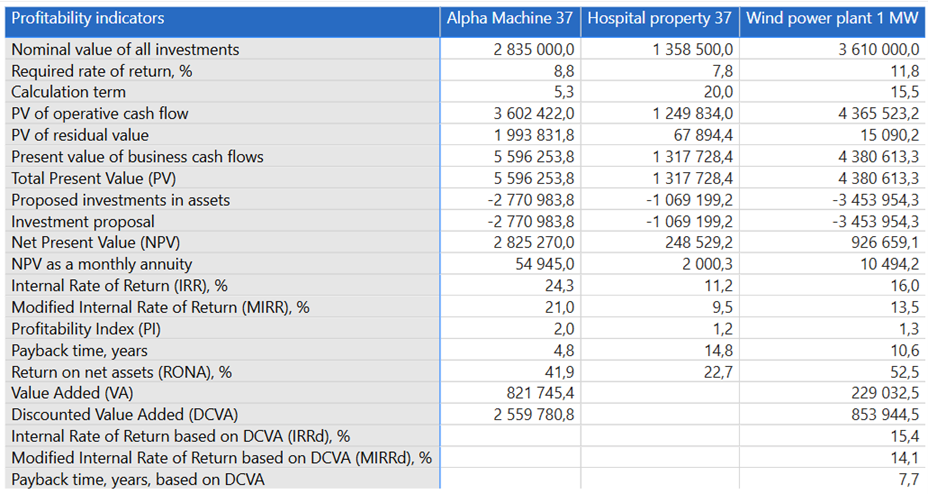
Example of a matrix report in Power BI. Profitability indicators.
Scenario comparison – Cumulative Total Cash Flow of several scenarios
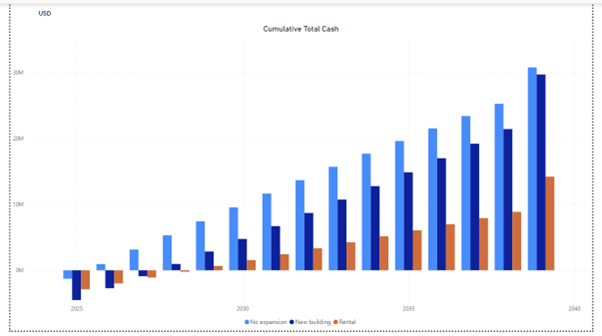
Example of a chart in Power BI – Cumulative total cash flow of three scenarios: no expansion, a building, rental.
Summary
Combine the powerful Invest for Excel® software for cash flow modeling, investment appraisals and valuation with apps for advanced analytics and visualization such as Power BI.
Make visually appealing reports fully customised to your needs that will bring advanced analysis on portfolio of projects, fast and effortlessly.
Develop and implement investment strategies, oversee and manage investment portfolios, conduct due diligence on investment opportunities and ensure compliance with your objectives – with confidence.
Make recommendations to senior management regarding investment strategies backed with reports of high quality and advanced analytics.
Start now. Download and try Invest for Excel®. Data extract function is available in Invest for Excel version 4.2., in Pro and Enterprise editions. Contact us, if you have any questions and book a free discovery meeting.
More information – Contact us
Written by: Malgorzata Jargan, VP Business Solutions
Contact information: E-mail: mj@datapartner.fi, Mobile Finland: +358 40 70 41 493
DataPartner Oy
Raatihuoneenkatu 8A
06100 Porvoo
Finland
Tel. +358 19 54 10 100
E-mail: datapartner@datapartner.fi