When we use standard End-of-year discounting, theoretically, we assume that the entire value of cash flow for a given year comes in at the very end of that year:
Picture 1. End-of-year discounting

However, in reality, a business may generate a smooth income stream throughout the year:
Picture 2. Actual cash transactions

To provide more accurate figures we can use Mid-year discounting. With Mid-year discounting we discount the cash flows as if they occurred in the middle of the year. Thus, cash flow for year 1 will be discounted over a period of 0.5, cash flow for year 2 over a period of 1.5 and etc:
Picture 3. Mid-year discounting

When your calculation is created on yearly basis you can use Mid-year discounting. Note that Mid-year discounting should not be applied when shorter periods (less than 12 months) are used!
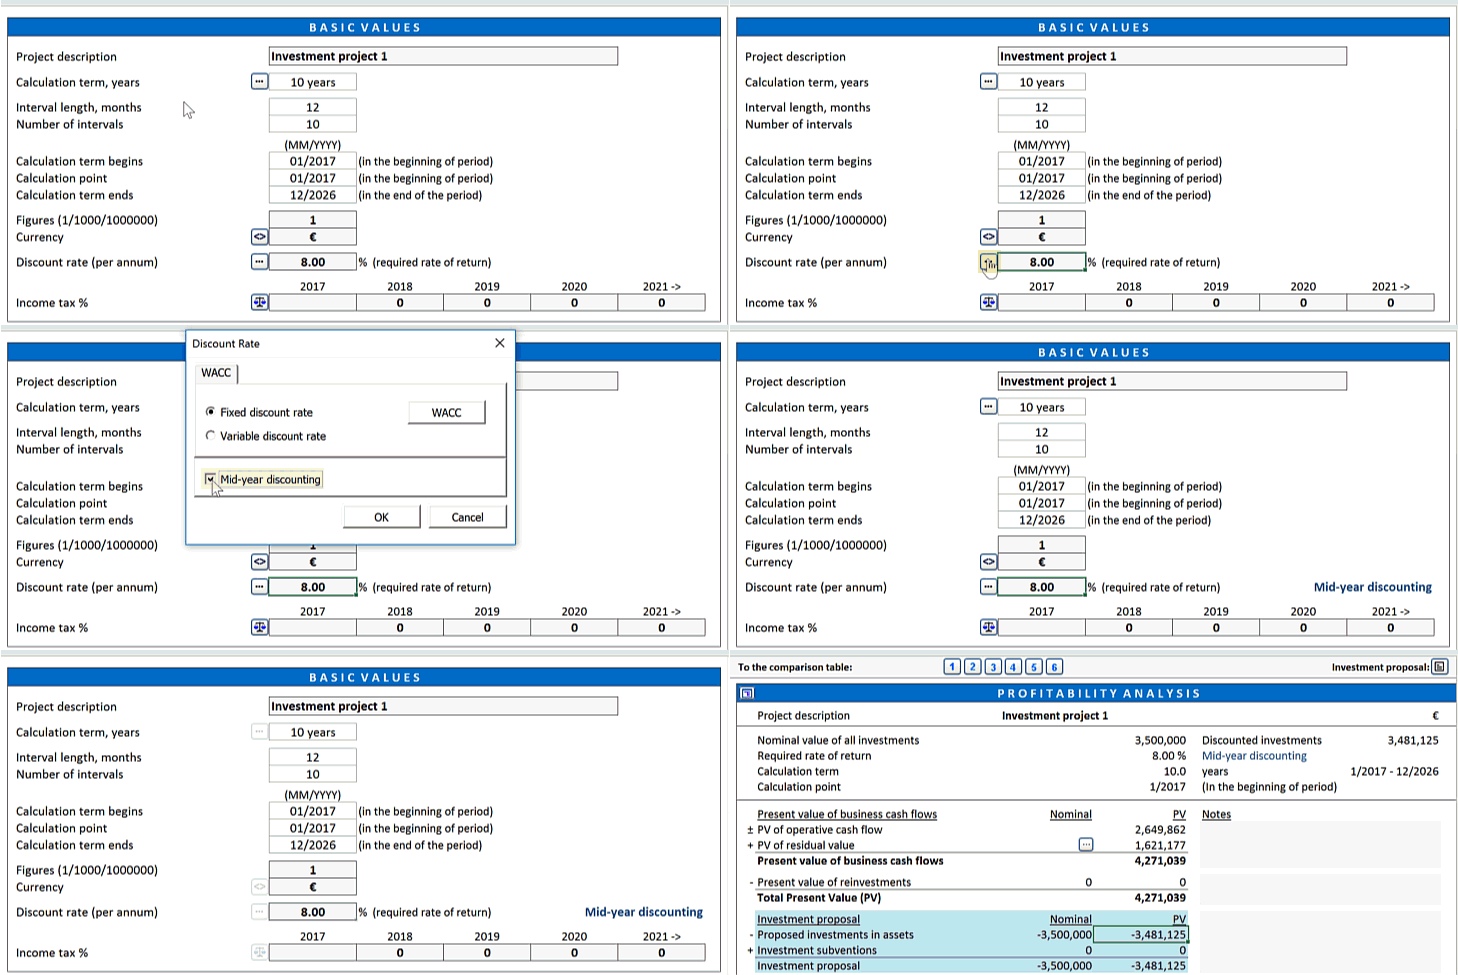
To turn on mid-year discounting in Invest for Excel:
- Open the “Discount Rate” dialog box from the “Basic Values” screen of the calculation file
- Check “Mid-year discounting” in the dialog box

When you use Mid-year discounting, the corresponding notes appear in “Basic values” and “Profitability analysis” screens.
Zero-period and Residual value are unaffected and are calculated the same way in mid-year discounting and end-of-year discounting.
Extrapolated residual value is calculated as end-of-year cash flows in both mid-year discounting and end-of-year discounting.
Example: Mid-Year discounting vs End-year discounting
Now let’s compare resulting NPV by applying these 2 different discounting methods (discount rate is 8%)
Option A. Mid-year discounting:
Net Present Value (NPV) = 789 914 (€)
Option B. End-of-year discounting:
Net Present Value (NPV) = 708 045 (€)
