
Here it comes! The latest Invest for Excel® Version 4.2 is out now – you will be impressed with the new functions, which will bring your analysis to another level! Without further ado, let’s see what our development team prepared for you.
1. Data Extract function and use cases
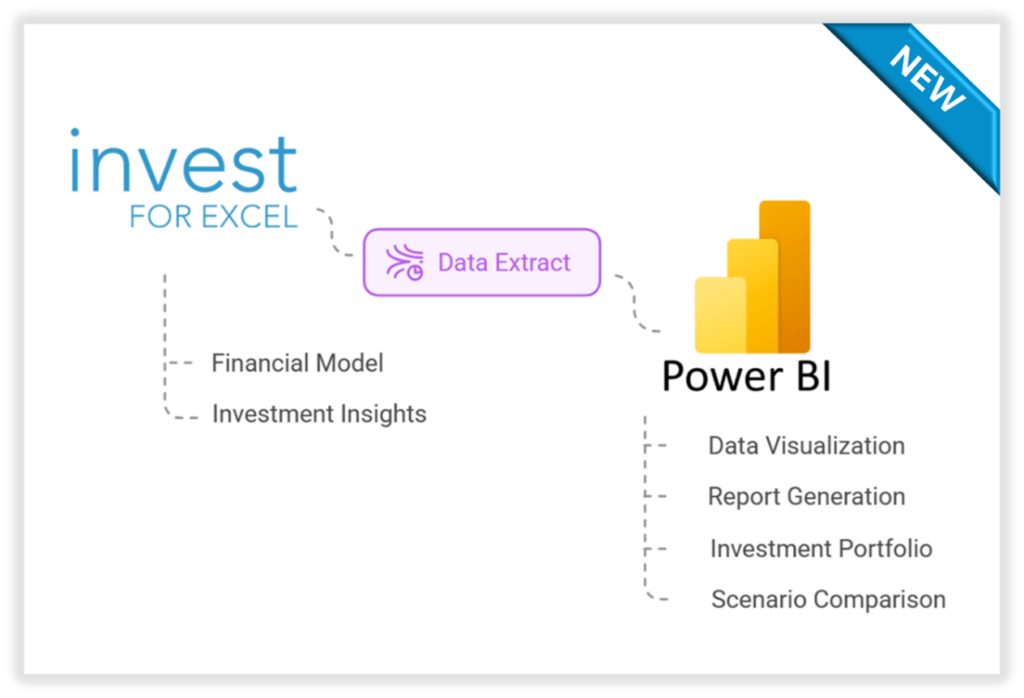
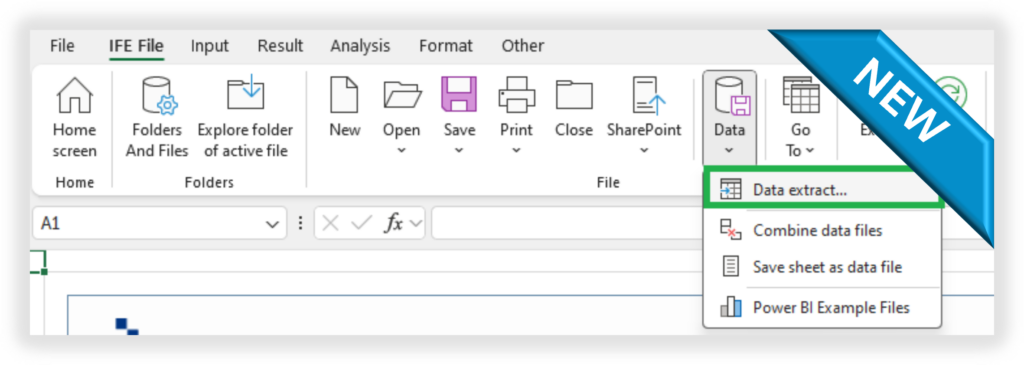
Use a new function of Data Extract in Invest for Excel® version 4.2, edition Pro and Enterprise. Extract data from financial models created in Invest for Excel® calculation files just in one-click (press a button). Use data extracts in various ways, for example:
- connect to Power BI, Power BI Desktop (a free app) and create advanced reports, charts and more,
- use to analyse calculation data in Excel, for example in using Pivot tables,
- connect to other apps.
No experience in Power BI yet? If you are a beginner or have never explored the app, you may want to use free Power BI reports – example files designed by Datapartner – and create own advanced reports in minutes. Gain powerful control over your data and impress with professional reports, fast.
In Power BI and Power BI Desktop, the data extract enables users to design and create customised, visually appealing reports, for example:
- Investments/ Project Portfolio,
- Consolidation,
- Selective view of multiple projects in the portfolio or just a single project,
- Scenario Comparison, and more.
Get the edge on overseeing and managing investment strategies and protecting your profitability.
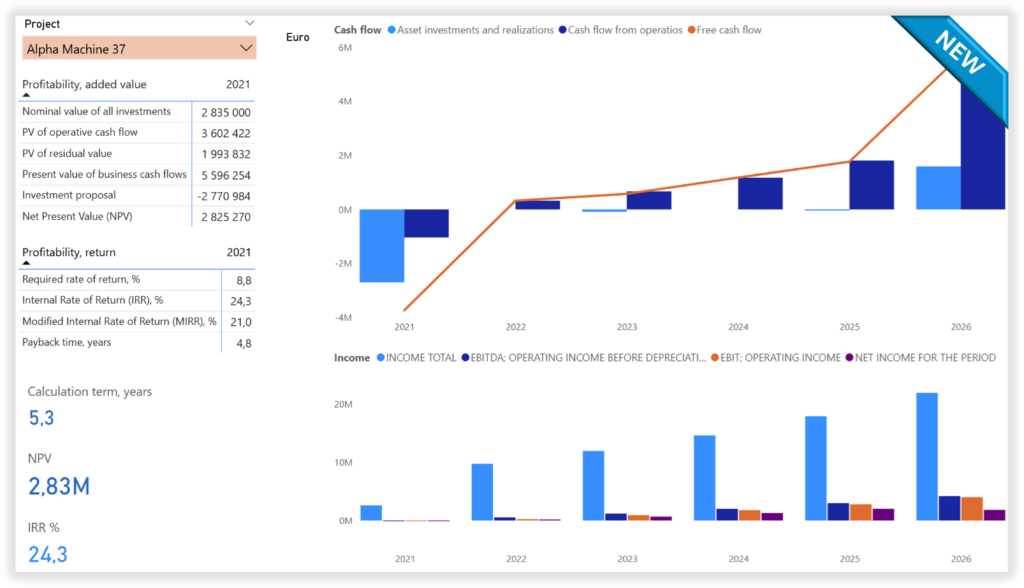
2. Reports in Power BI – free example files designed by Datapartner
View the example files in Power BI designed by Datapartner. You may want to consider updating the example report files with own data extracts and creating your portfolios! The files include, for example, insights, reports and analyses regarding:
- Profitability
- Investments and Realisations
- Income
- Cash flow
- Working Capital
- Assets chart
- Cash flow chart
- Cash flow development chart
- Key financials
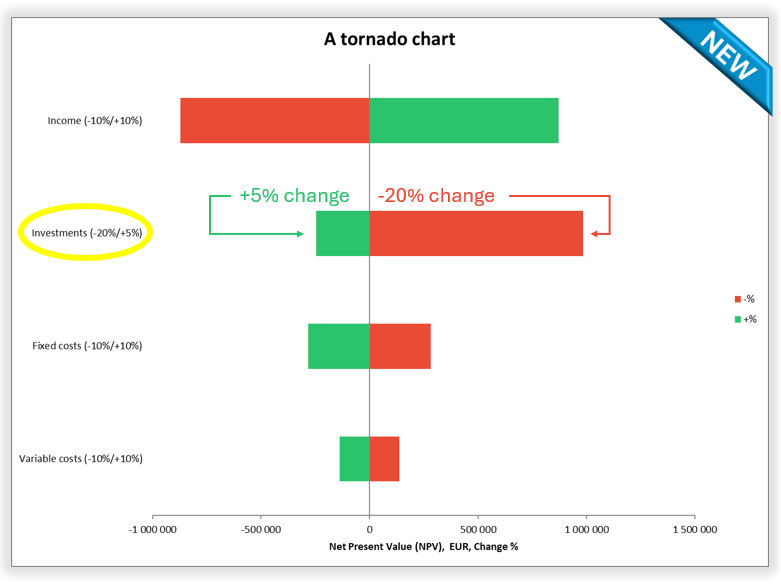
3. Individual change percentages in Tornado
You can use individual change percentages in a Tornado analysis chart. Choose the row for which you want to enter individual change percentages. For example, some variables can have +/- 10% change setting, while some other have +/- 15% change. Each variable can have an individually set change %.
Click the %-button above the list and enter change percentages in the form that opens.
The individual differences are shown in the Tornado chart.
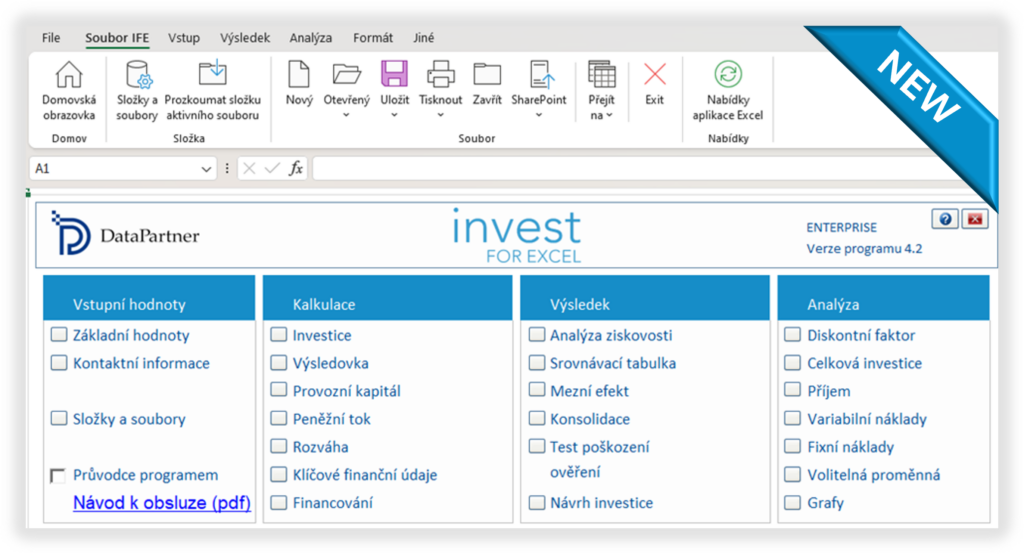
4. Czech language
Czech language has been added to Invest for Excel®.
5. And many other functions

“Exit Invest for Excel without exiting Microsoft Excel”, “Show Value Added (VA) rows” and many other functions – read a full PDF on What’s new in Invest for Excel 4.2. here.
More information – Contact us
Written by: Malgorzata Jargan, VP Business Solutions
Contact information: E-mail: mj@datapartner.fi, Tel. Finland: +358 19 54 10 121
DataPartner Oy
Raatihuoneenkatu 8A
06100 Porvoo
Finland
Tel. +358 19 54 10 100
E-mail: datapartner@datapartner.fi