
Invest for Excel® - Overview
Try for free


Financial model and Analysis
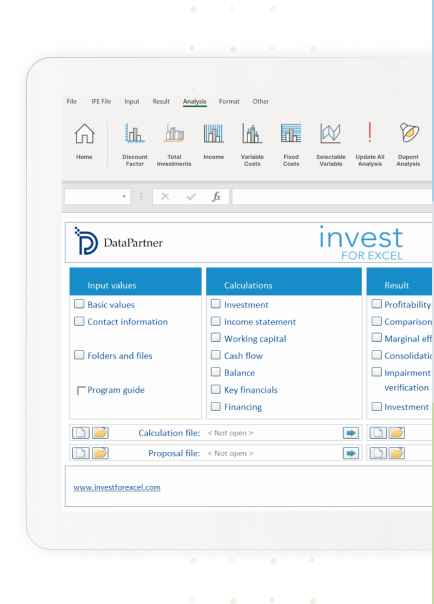
Invest for Excel® features the pre-automated interlinked three financial statement model – Income Statement, Cash-Flow Statement, Balance Sheet, and Analysis.
Build financial model flexibly and save 50%-80% time.
Perform standardized and comparable financial analysis and business valuation of any project or investment with confidence – and ease.
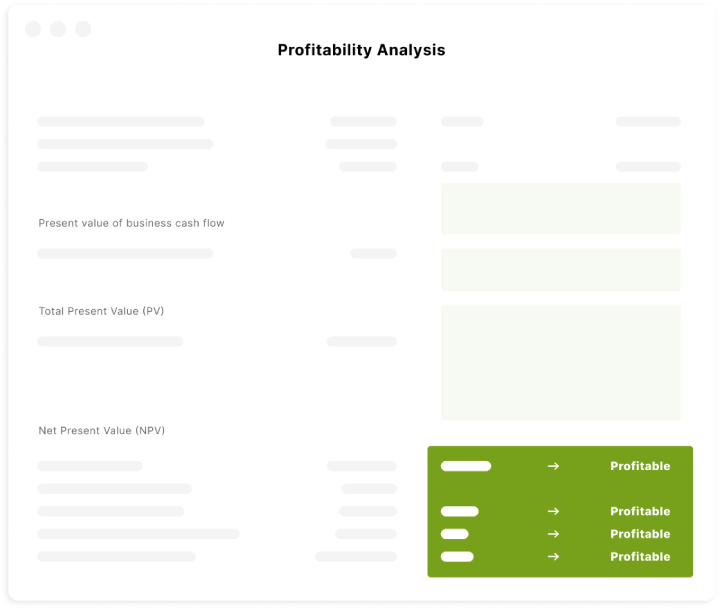
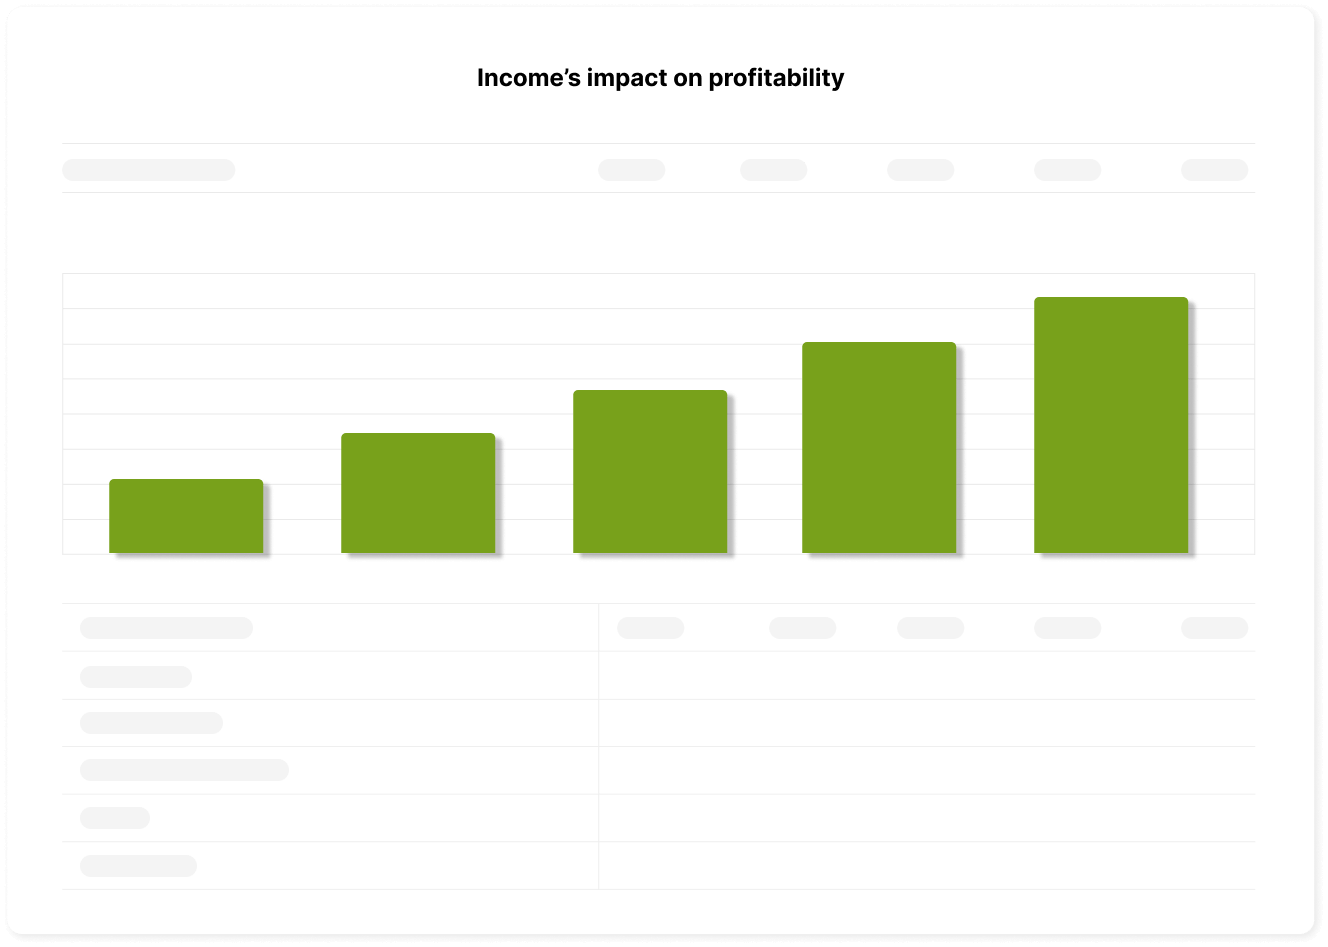
DCF Profitability Analysis
Get discounted cash flow (DCF) valuation for your financial model. Discover profitability indicators incorprating time-value of money: NPV, NPV as a monthly annuity, IRR, MIRR, Profitability Index, Payback and more.

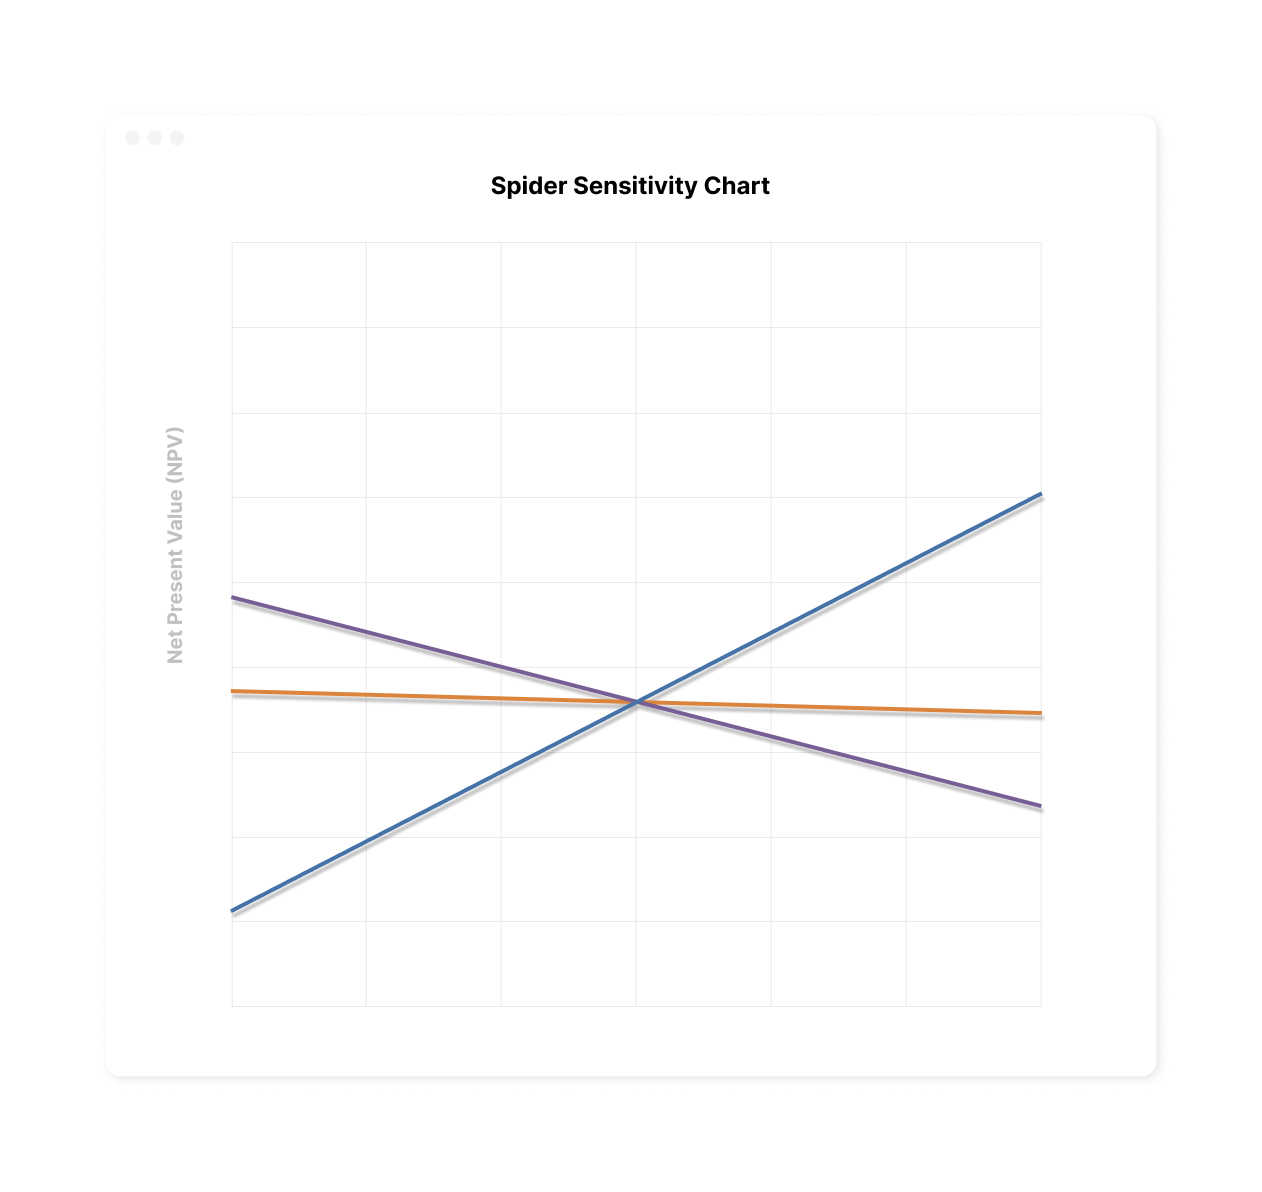
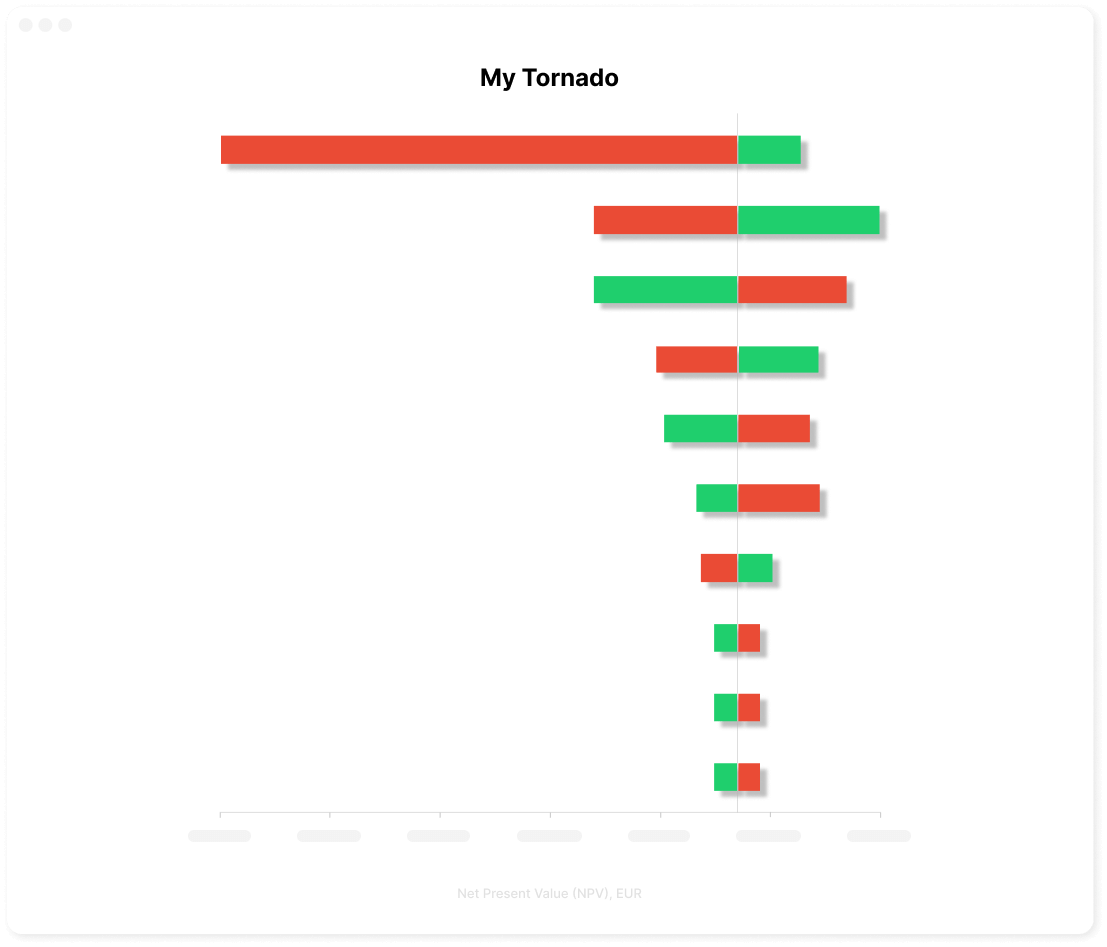
Sensitivity Analysis
Use in-built ”What-If” Sensitivity Analysis to analyze your model. Select variables from the model flexibly. Create personalized Tornado sensitivity charts and Spider sensitivity charts with ease – add parameters to the analysis on click. Discover variables that have the most critical impact on the profitability.
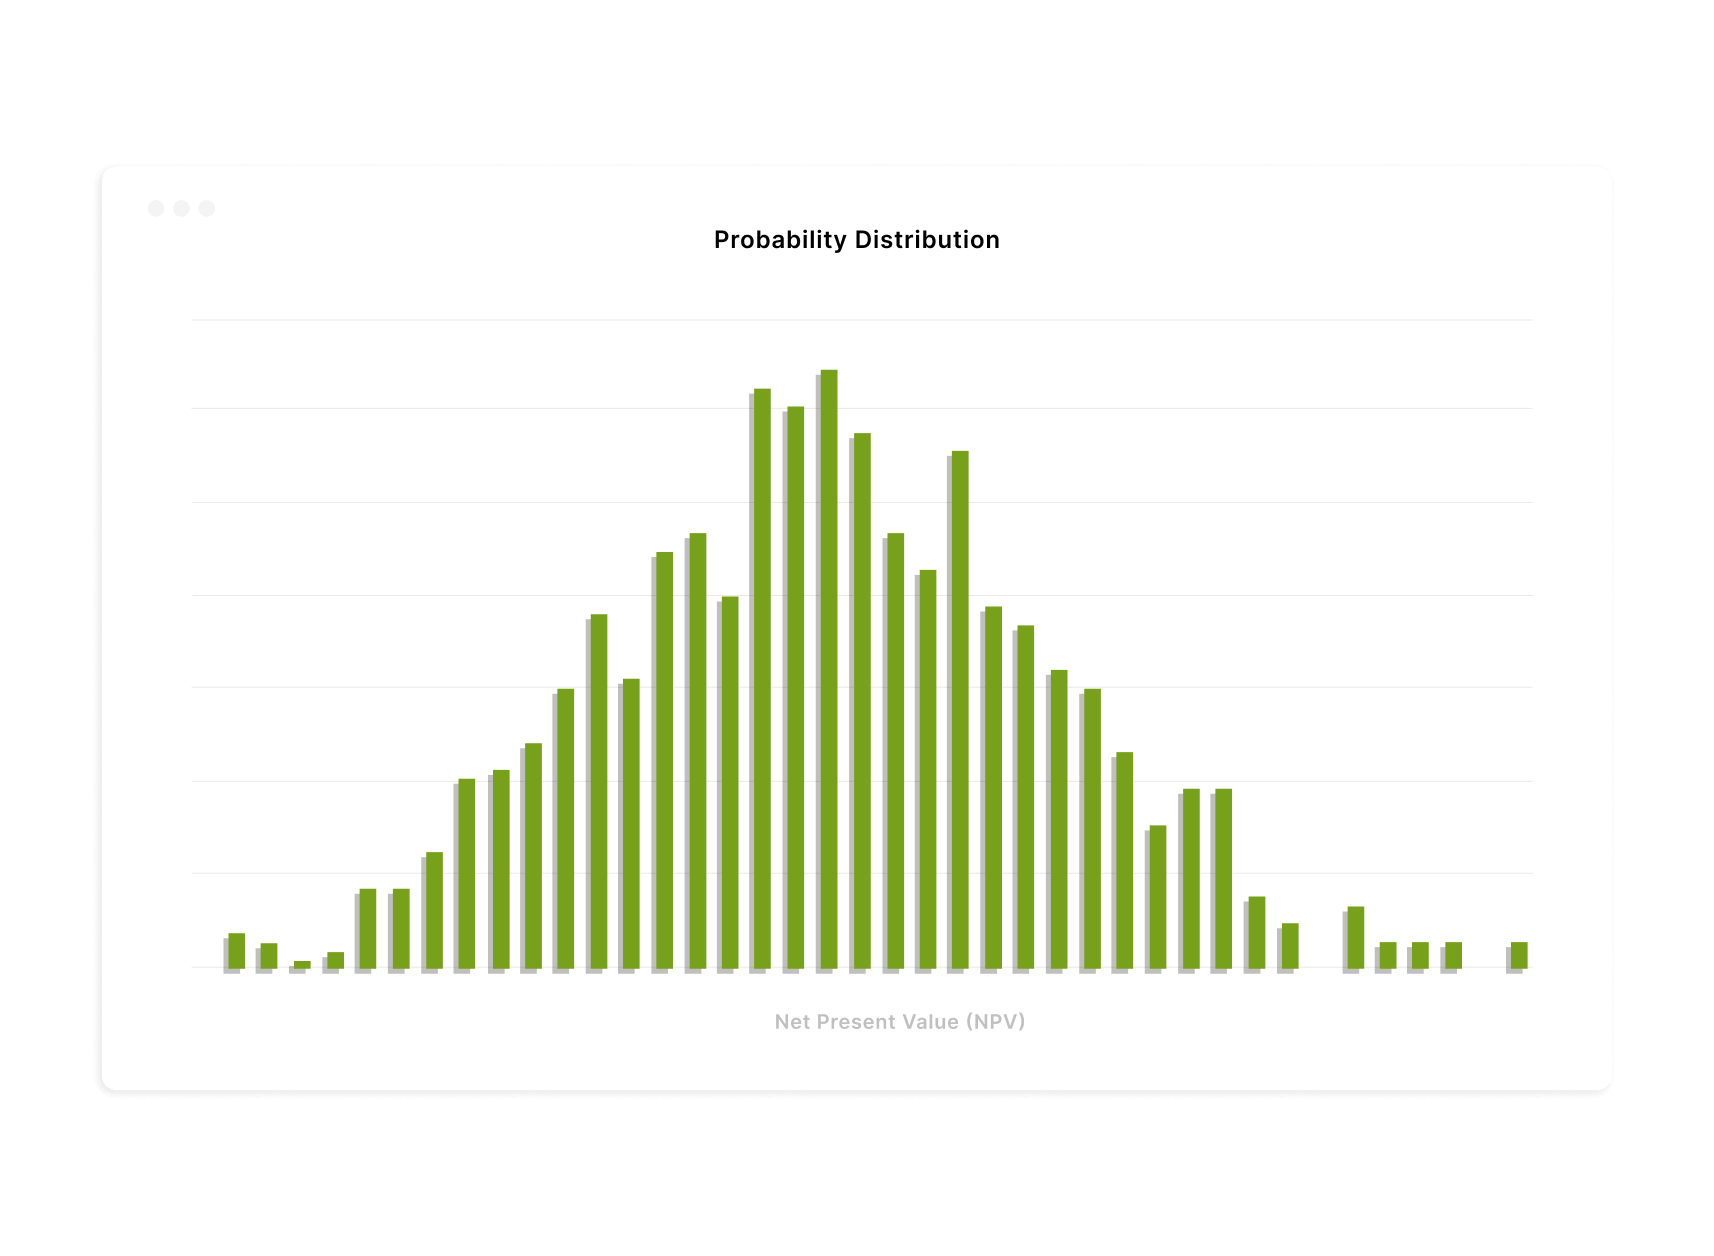
Monte Carlo Risk Analysis
Use Monte Carlo simulation to estimate the impacts of various risks and uncertainties on the profitability of your modelled case. Select variables from the calculation model, define assumptions, and click to run the simulation. The probability distributions produced by a Monte Carlo model create a picture of risk. See the probability of unprofitable project – among many insights. Use as many variables as you wish.
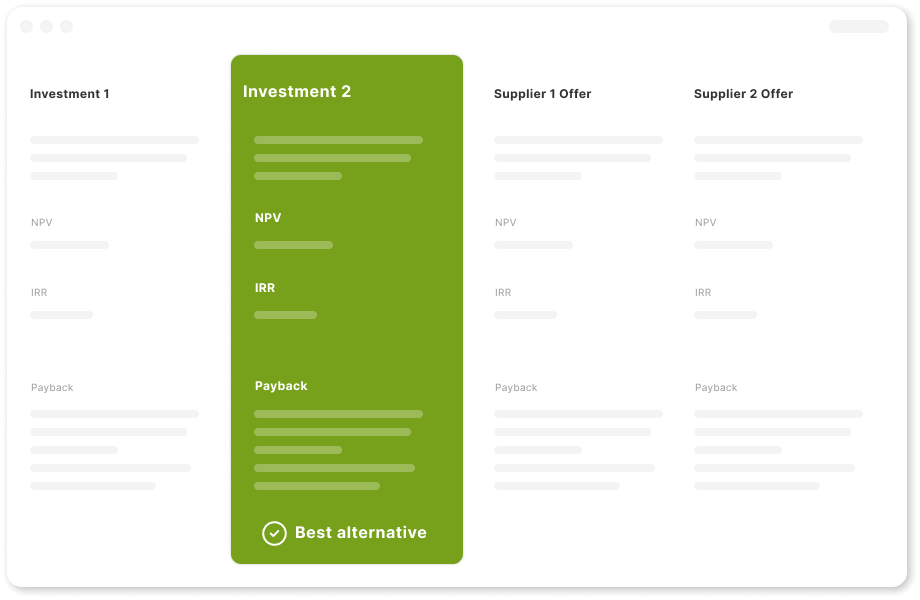
Comparison Table
Compare calculations side-by-side, like apples-to-apples, on click. Prioritize alternatives and clearly depict differences between various scenarios and options.
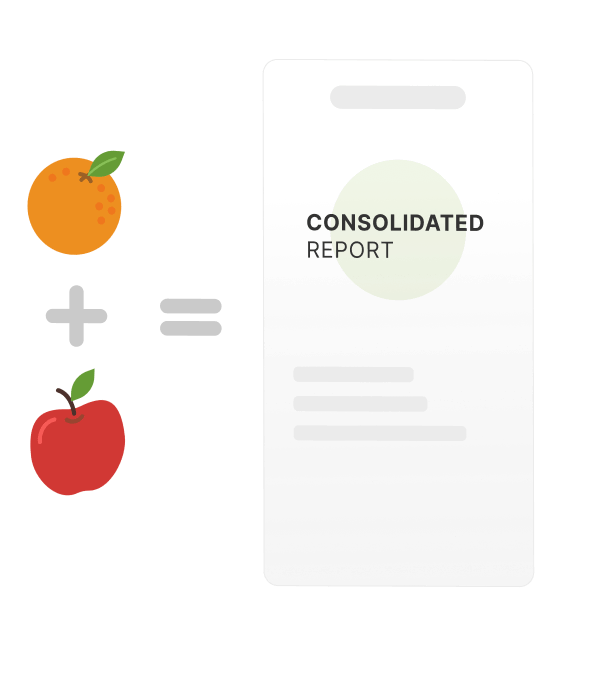
Consolidation
Consolidate different calculation files - your projects, investments and subsidiaries on a click! Get a consolidated report of Income Statement, Cash-Flow Statement, Balance Sheet, Profitability Analysis and more. See Investment Portfolio overview.
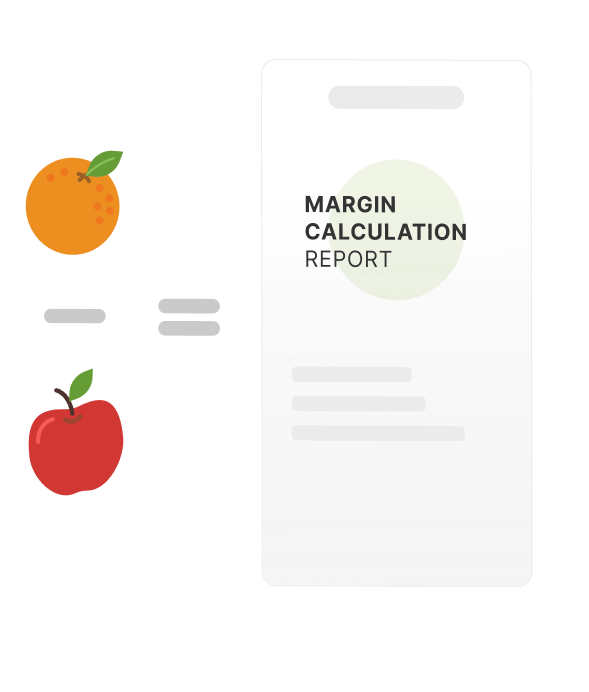
Margin calculation
Find difference between two calculations – for example a calculation depicting situation after an investment and before an investment. Determine the profitability on the calculated difference.
Break-even on an input variable
Find break-even on an input variable. Determine the minimum and maximum values of parameters in your calculation to better assess the safety range and feasibility.

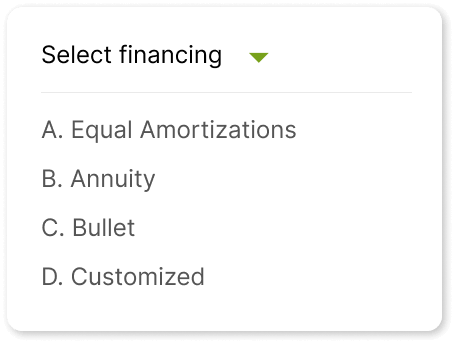
Financing module & Liquidity planning
Make the financing plan for your project calculation and check the liquidity in few clicks.
The module is synchronized with the calculation file. Easily update the project calculation with the financing cash flows on-click.
Investor's return: Profitability calculation based on Free Cash Flow to Equity (FCFE)
Get the insights on profitability based on FCFE (Free Cash Flow to Equity), in addition to FCFF (Free Cash Flow to Firm). Determine how the financing leverage affects the profitability and what the investor’s return is.
Corporate Acquisitions and Valuation
Get the profitability evaluation of an acquisition of a business or a business function.
Find out what the recommended purchase price is. Find the effects of the acquisition on acquiring company (goodwill).
Business planning and Valuation
Use the business plan template with historical years added by default. Calculate Enterprise value and Equity, and use other features for successfully planning and valuing a business.
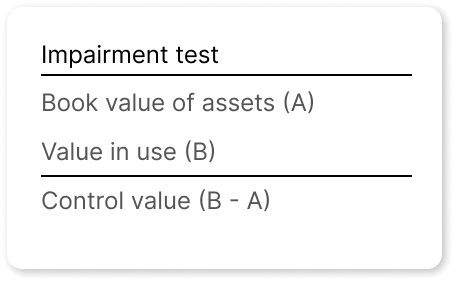
Impairment testing, US GAAP and IFRS functionality
Calculate ”Value in use”, which is needed when applying IAS 22, IAS 36 and IAS 38, to perform periodical impairment tests.
Make impairement test verification by comparing the value in use to the tested assets book value.
Impairement testing is available for corporate acquisitions or fixed assets – on click.
Your Benefits using Invest for Excel®
Invest for Excel® provides a complete overview on investment planning or business valuation enhancing the quality of management process
Great modeling tool for any kind of business
Structure and clear functionality with the flexibility of MS Excel-based software
Standardized investment calculations and proposals to enable easy comparison or consolidation of various projects
Calculation errors are eliminated
Nothing of importance is by chance left out of the calculation, as Invest for Excel® guides the user in calculations
Calculations and reports can be distributed as MS Excel files
Excellent presentation tool, for example in steering committee meetings
Calculations made in Invest for Excel® can be linked to other calculations made in Excel worksheets
Range of ready reports can serve as a complete package for financing applications
User interface is easy to learn because it is based on MS Excel, the most widely used spreadsheet application today
Visual menus, manual, software guide, and dialog boxes give a friendly framework of work
Through 10 available languages that can be changed while working, the tool facilitates management of international business
Use Cases
For Academic Use